Architecting Cloud Industrial IoT Workloads – Part 3: AWS IIoT Reference Implementation for Equipment Failure Detection
- septiembre 14, 2022
This blog post is the 3nd of our Cloud IIoT blog series. In the first part, we discussed the IIoT use cases, how they are architected at a very high level, and their implementation challenges. In the second part, we have discussed the AWS IIoT landscape: the AWS services available to build end-to-end IIoT solutions. In this blog, we present and demonstrate an AWS IIoT Reference Implementation that showcases equipment failure detection. You can find the code on Github.
Use Case: Asset Condition Monitoring and Predictive Maintenance
The use case demonstrated in this blog post is the monitoring, prediction and alerting for industrial equipment failure. This is called asset condition monitoring and predictive maintenance.
The main technical challenge with condition-based monitoring is to collect data from different sensors, store and catalog them appropriately, at scale and securely. This is solved by using AWS IoT SiteWise which allows collecting, storing, organizing, and monitoring data from industrial equipment at scale.
The main technical challenge with predictive maintenance is the potential complexity to building and maintaining Machine Learning (ML) models for all sorts of equipment.
This is solved with Amazon Lookout for Equipment which automates the development of multivariate ML models for complex industrial assets and achieve nearly continuous monitoring with ease.
IIoT Reference Architecture
This solution demonstrates the asset condition monitoring and predictive maintenance for a pump station consisting of 2 pumps (assets). Each pump moves fluid by transferring the rotational energy provided by a motor to hydrodynamic energy.

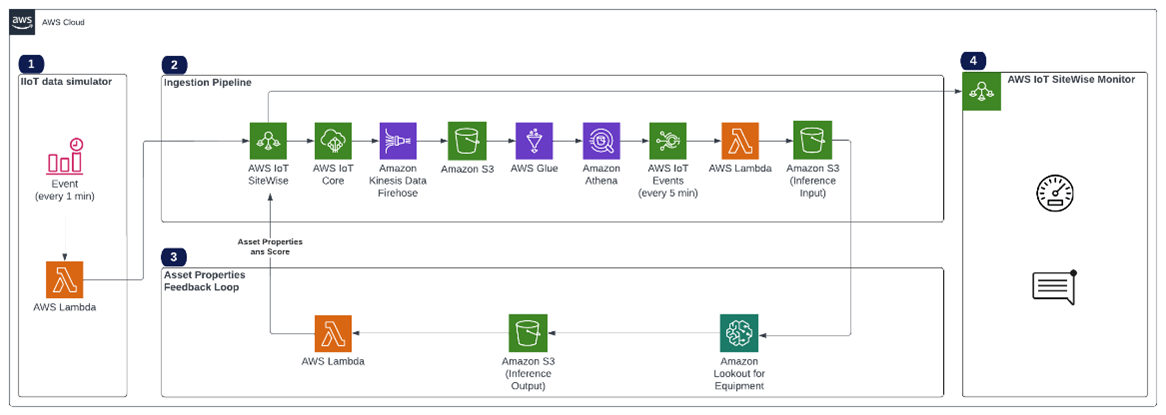
AWS IoT SiteWise and Amazon Lookout for Equipment integration architecture
Box 1 – IIoT Data Simulator: For demonstration purposes, the industrial assets IoT traffic is simulated with an AWS Lambda function and with Amazon CloudWatch event which trigger the Lambda function every minute. In a real world industrial implementation, the operational technology (OT) team can configure data sources, such as the OPC-UA server, to ingest asset data to AWS IoT SiteWise.
Box 2 – Ingestion Pipeline: AWS IoT SiteWise receives the data from our simulator.
To prepare the data for Amazon Lookout for equipment, we use the following steps:
- AWS IoT SiteWise notifies AWS IoT Core as it receives asset property data.
- A rule defined in AWS IoT Core sends these events to Amazon Kinesis Data Firehose.
- Firehose accumulates the data and periodically stores it in Amazon Simple Storage Service (Amazon S3).
- This raw data in the S3 bucket is transformed with AWS Glue.
- An AWS Lambda function queries this data every 5 minutes using the Amazon Athena APIs, then it stores the output in the Inference Input S3 bucket that will be used as input by Amazon Lookout for Equipment.
Box 3 – Asset Properties Feedback Loop: ML models are trained in Amazon Lookout for Equipment using the historical data from our industrial assets. Once these models are ready, we schedule the inference to process the data from our Inference Input S3 bucket.
Then the inference result data is stored in the Inference Output Amazon S3 bucket. This data contains a score calculated by Amazon Lookout for Equipment, it indicates if the asset behaves abnormally.
Every new file written in the bucket triggers a Lambda function which sends the data to AWS IoT SiteWise. This score is then used in the dashboards in Box 4.
Box 4 – AWS IoT SiteWise Monitor: AWS IoT SiteWise Monitor is used to create dashboards with the combined data (from our assets and score calculated by the ML models). The dashboards are managed web portals which can be accessed by the OT team. They provide near real-time insights to the OT teams.
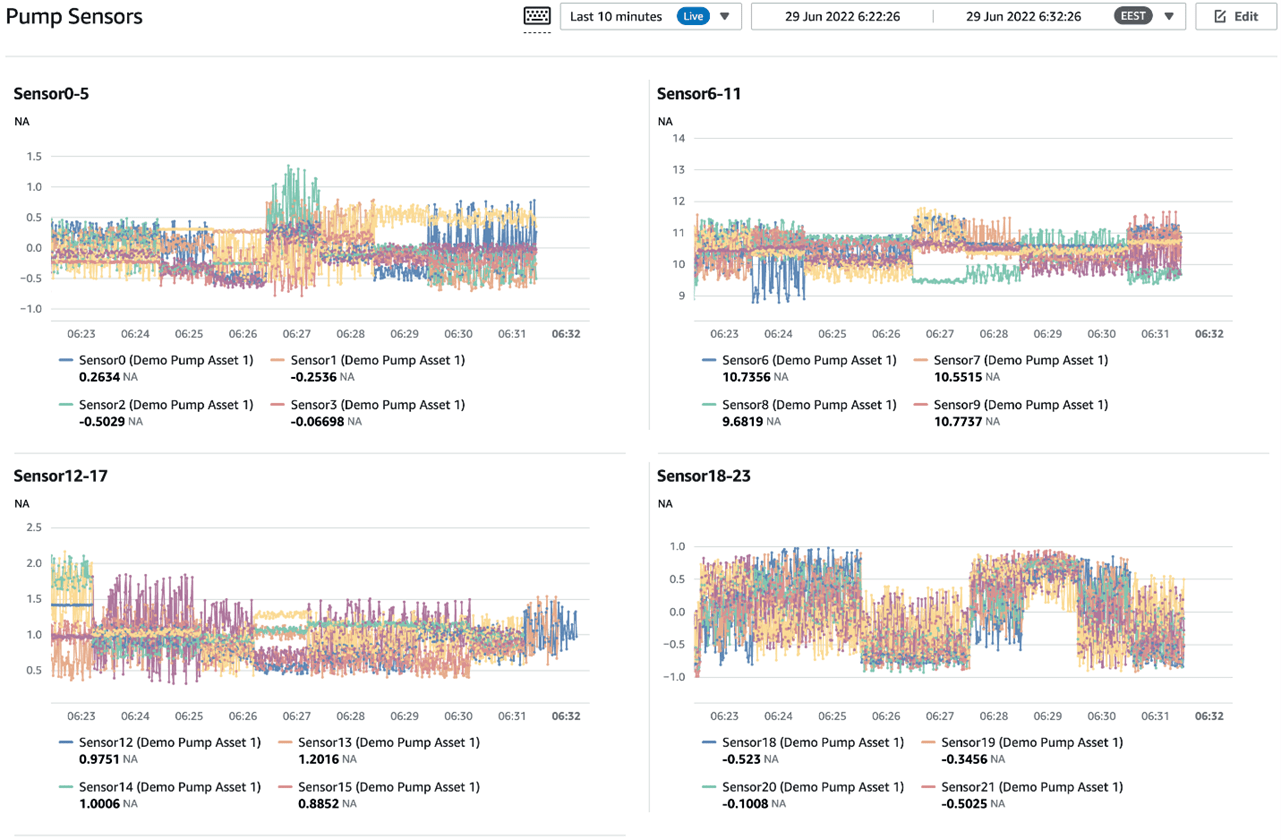
The screenshot below shows near real-time sensor data values from our pump.

Dashboard in AWS IoT SiteWise Monitor showing sensor data
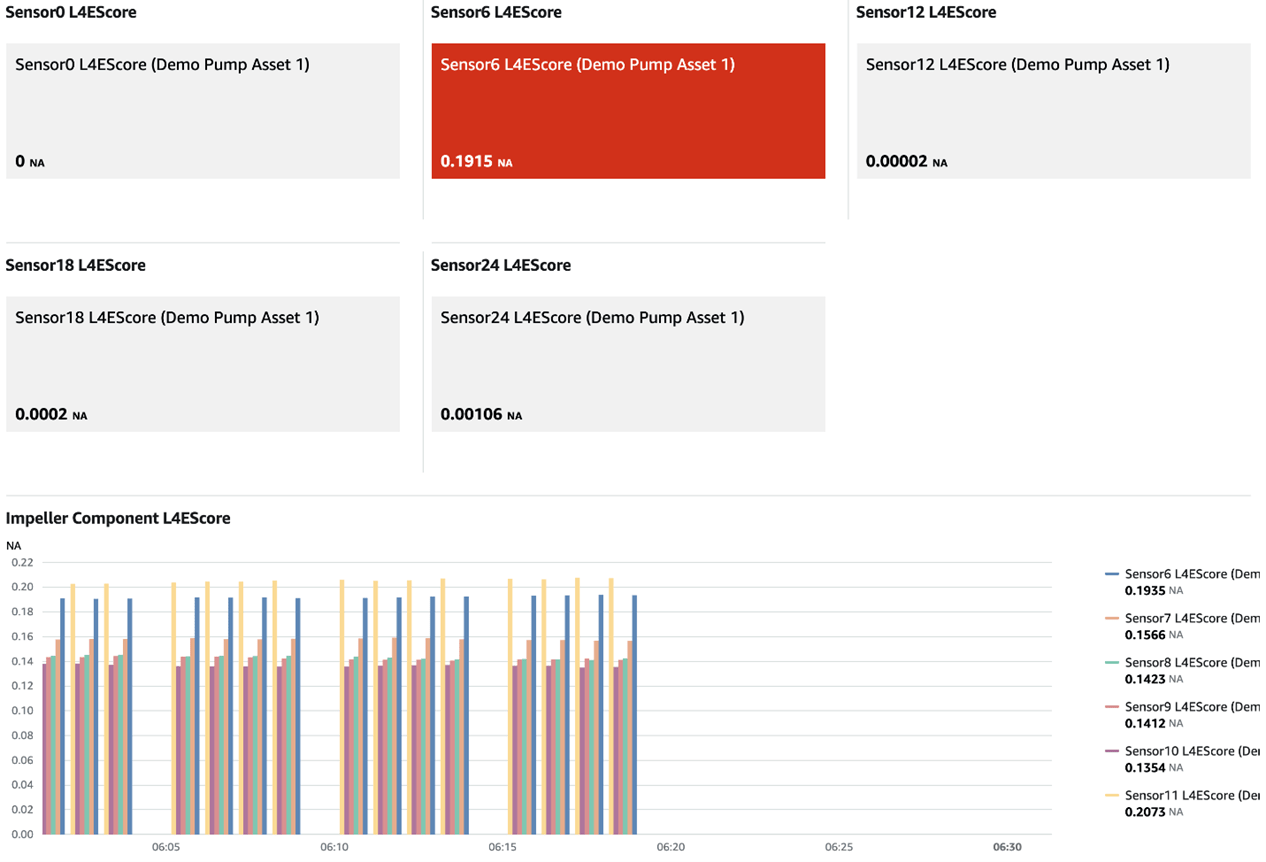
The following dashboard shows the scores calculated by Amazon Lookout for Equipment. An anomaly has been detected from the sensor 6 data.

AWS IoT SiteWise dashboard showing anomaly scores
If you found this helpful, browse other blog posts in the NTT DATA Tech Blog (scroll to the bottom to subscribe) and learn more about our manufacturing, automotive and energy services.
Subscribe to our blog


